
Product
ION Analytics - Inframation News
Role
Design Lead
Responsibilities
Hypothesis 1 - Identifying assets before they come to market. Identify future transactions in closed-end funds nearing maturity.
Hypothesis 2 - Learn of new transactions that match a mandate. Proactively notify users when new transactions match their investment mandate.
Hypothesis 3 - Market analytics to support origination and execution. Aggregated insights across search results to show historic value/volume to identify market trends.
Hypothesis 4 - Organisation analytics to track the key players in the industry. Aggregated insights across search results allow investors to expand their network by identifying the active players across all roles.
Product Engagement - Identifying assets before they come to market. Identify future transactions in closed-end funds nearing maturity.
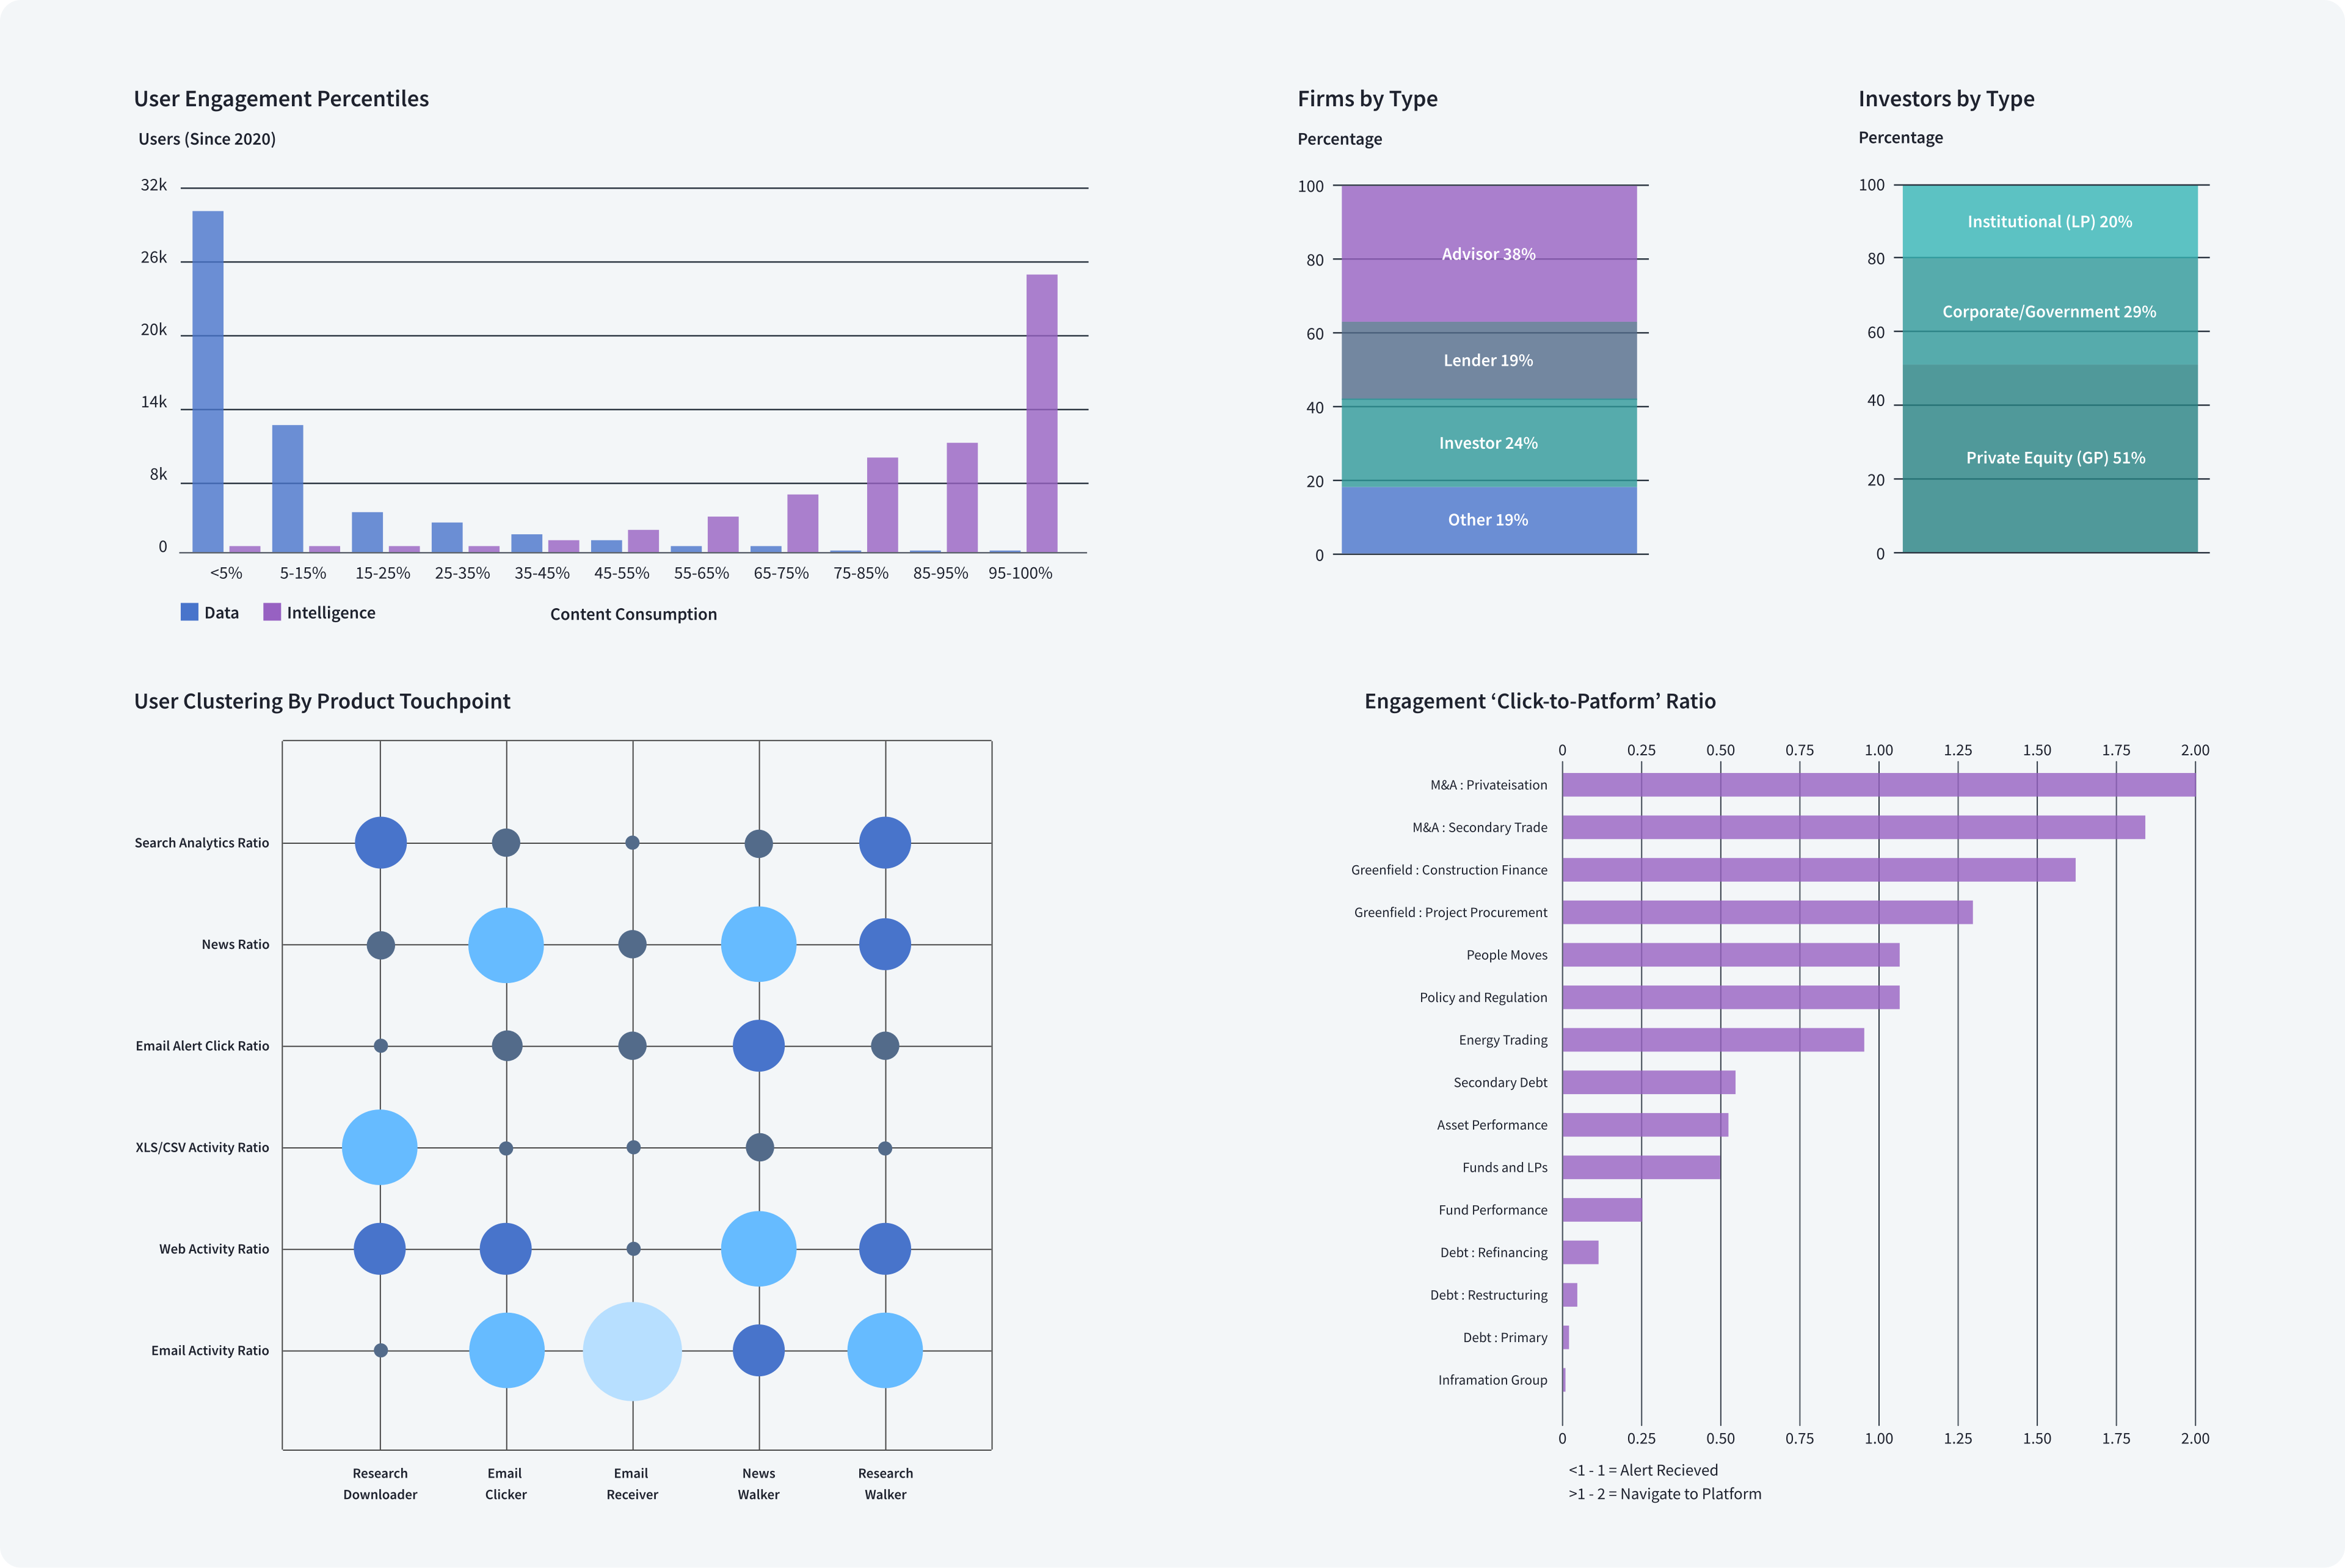
News vs Data - 65% of users consume 75% of their content through news, while only 4.2% of super-users consume 75% of deal data.
Growing engagement - The investor group saw the most growth on the platform, this was driven by the growing interest in Private Equity in the Infrastructure space driven by increased investment opportunities.
Notifying users of key situations - Content that drove the most engagement to the platform were themed mainly around sourcing/origination and networking opportunities. Content types that drove the least engagement to the platform were themed around debt refinancing and fund performance.
Hypothesis 1: Identifying assets before they come to market.
Validated - 7 out of 8 investors saw value in mapping assets in mature funds to identify future investment opportunities, with 1 investor saying that they prefer to rely on their network when seeking investment opportunities.
Hypothesis 2: Learn of new transactions that match a mandate.
Validated - All 8 out of 8 investors saw value in being notified when new transactions match their investment mandate.
Hypothesis 3: Market analytics to support origination
Validated - 5 out of 8 investors valued aggregated insights to identify market trends, while three preferred reports from their internal analysts instead of relying on a single source.
Hypothesis 4: Organisation analytics to track the key players in the industry.
Not Supported - 6 out of 8 investors said they would not rely on a platform to expand their network, as they had their own established connections in the industry.
Alongside the ongoing design and development of Infralogic, the design team used the new platform to lay the foundations of the Design System. The development of the design system meant that a second product team was able to apply the components extracted from Infralogic into the design system to test the viability of another project by plugin into an API and test hypotheses with real users all in under a week. This led to a huge reduction in development costs and time to validation
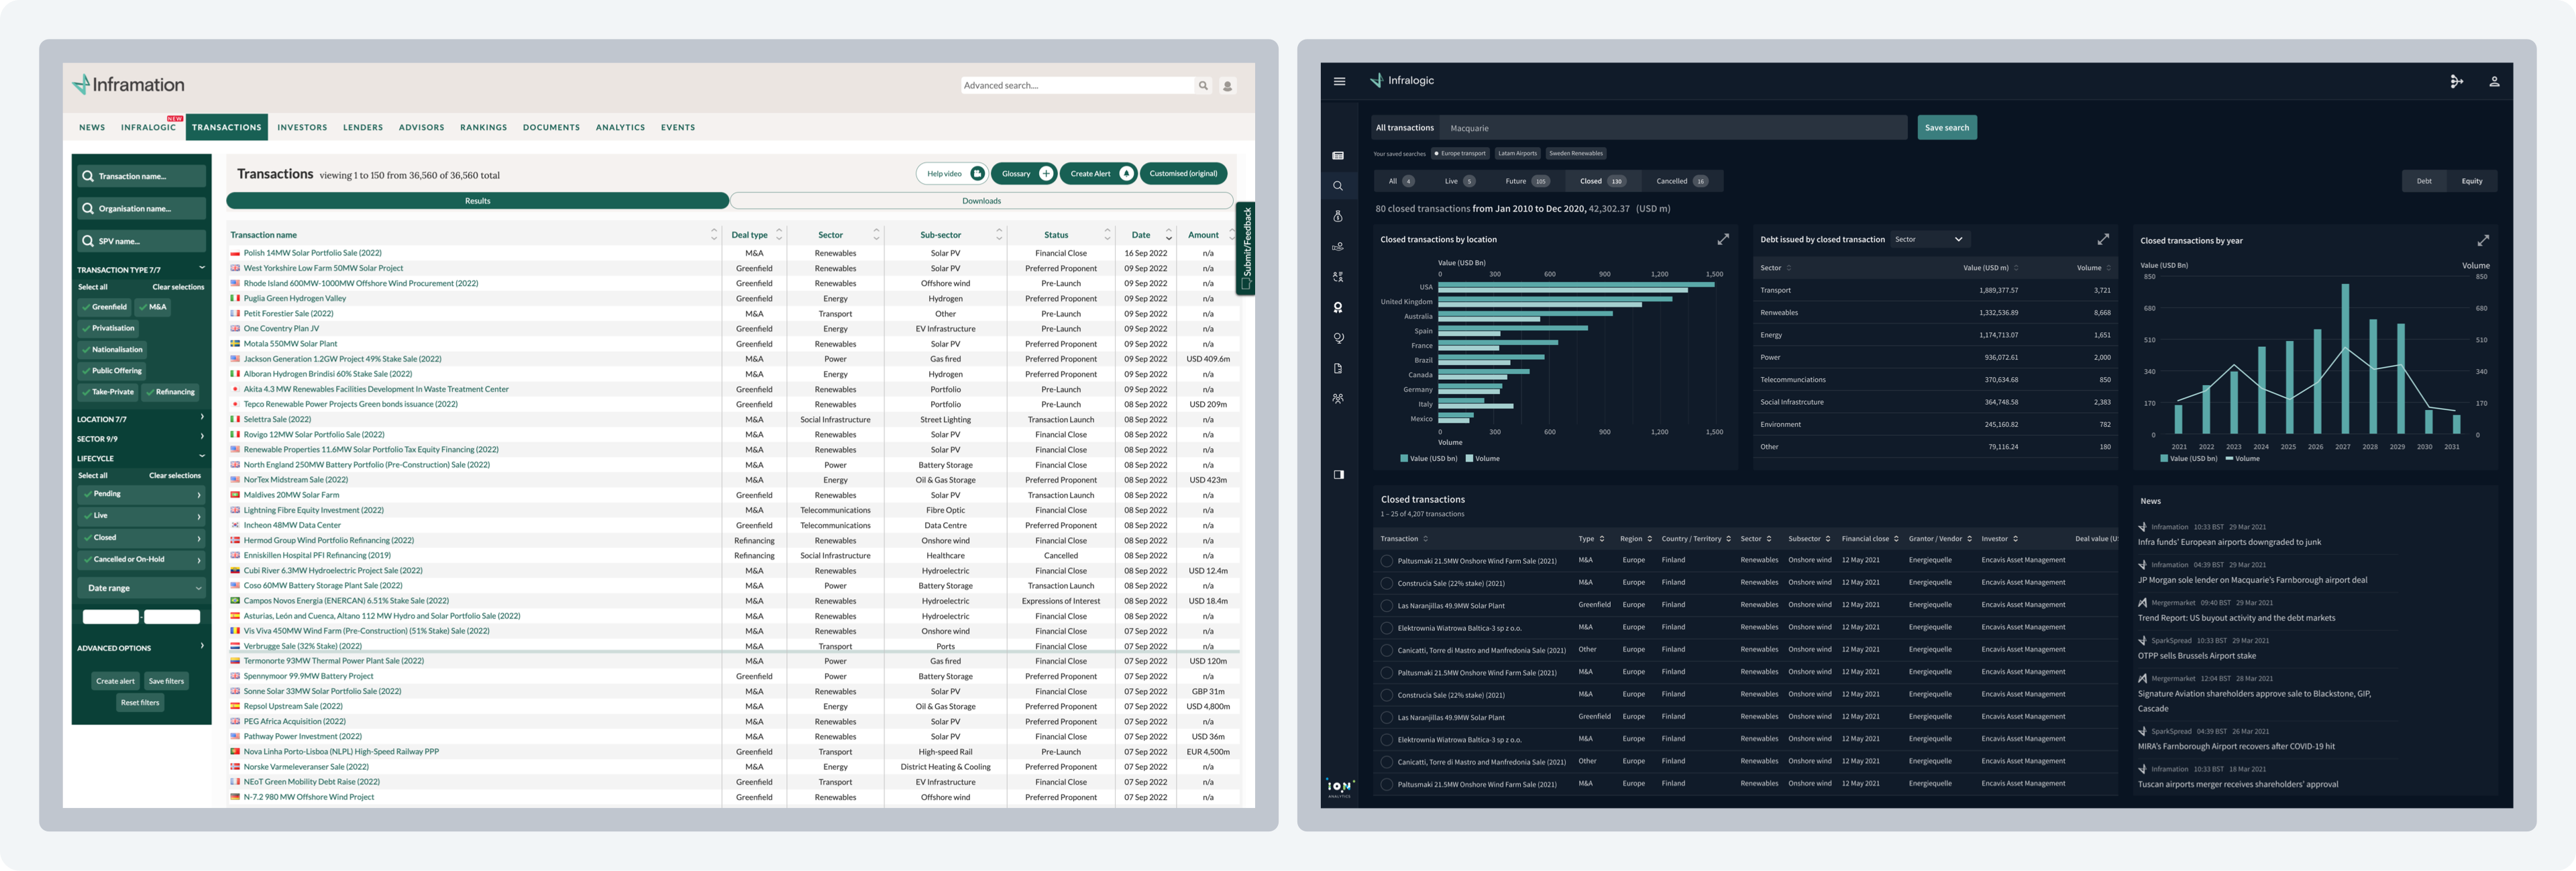
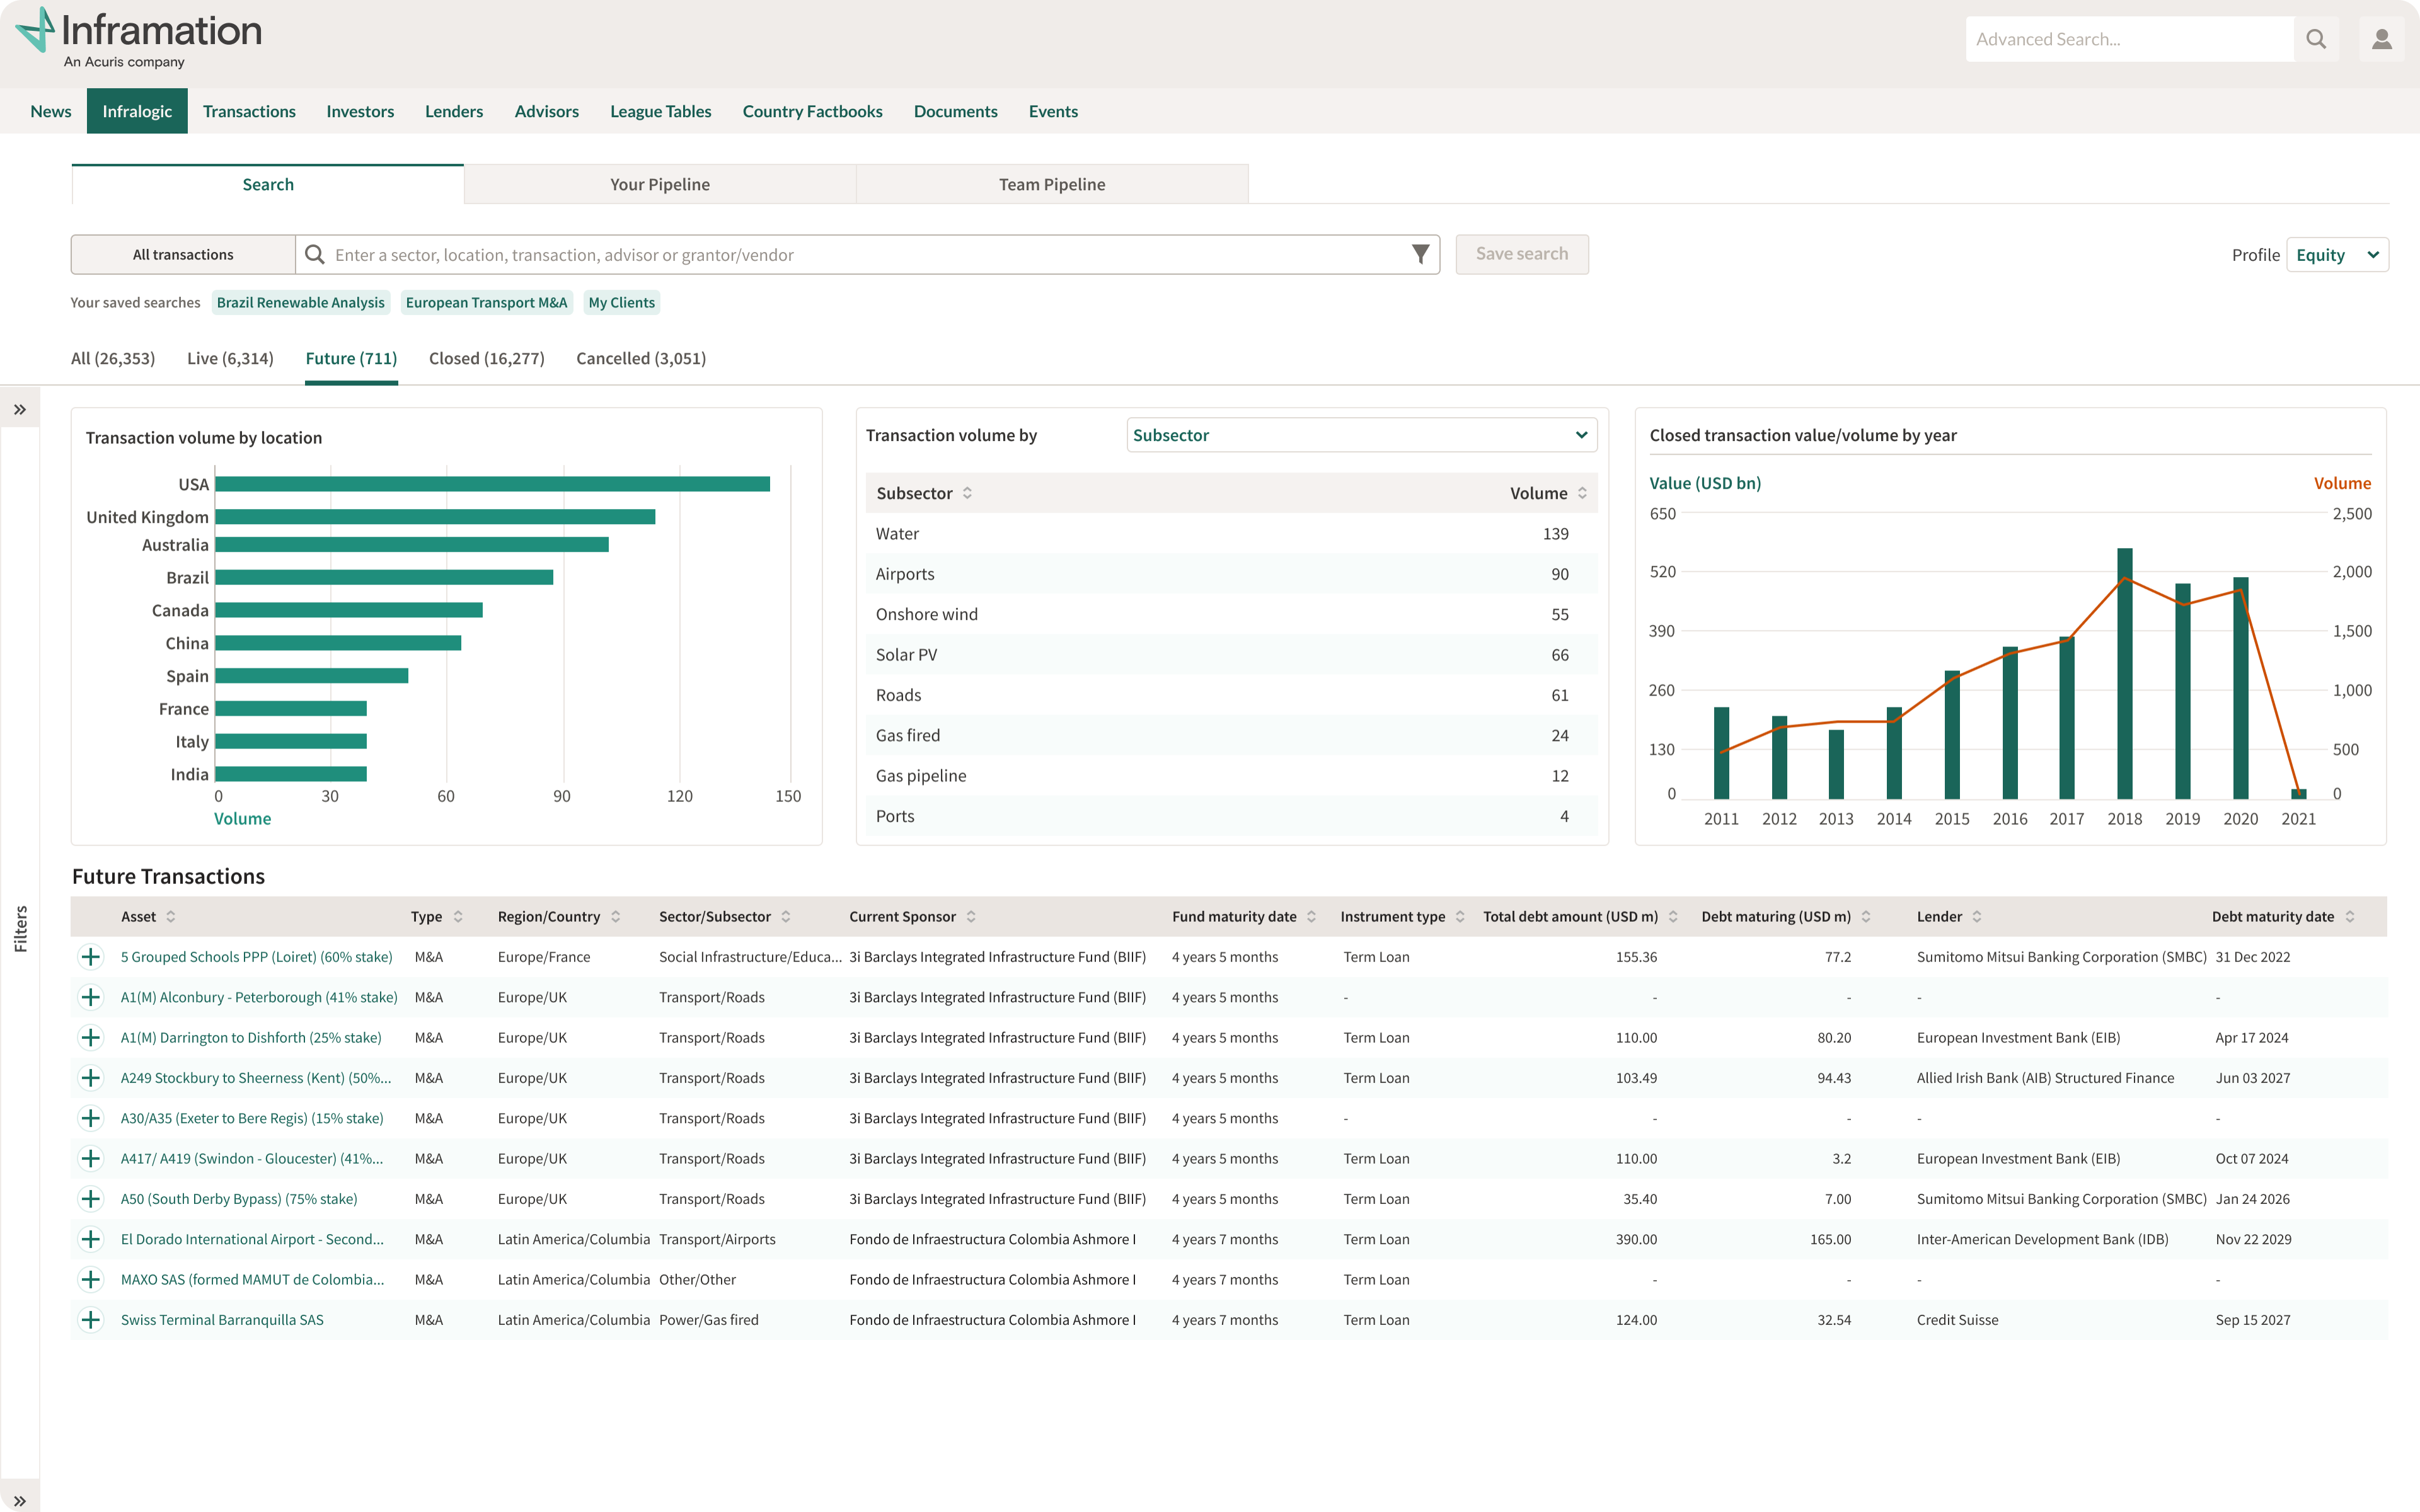
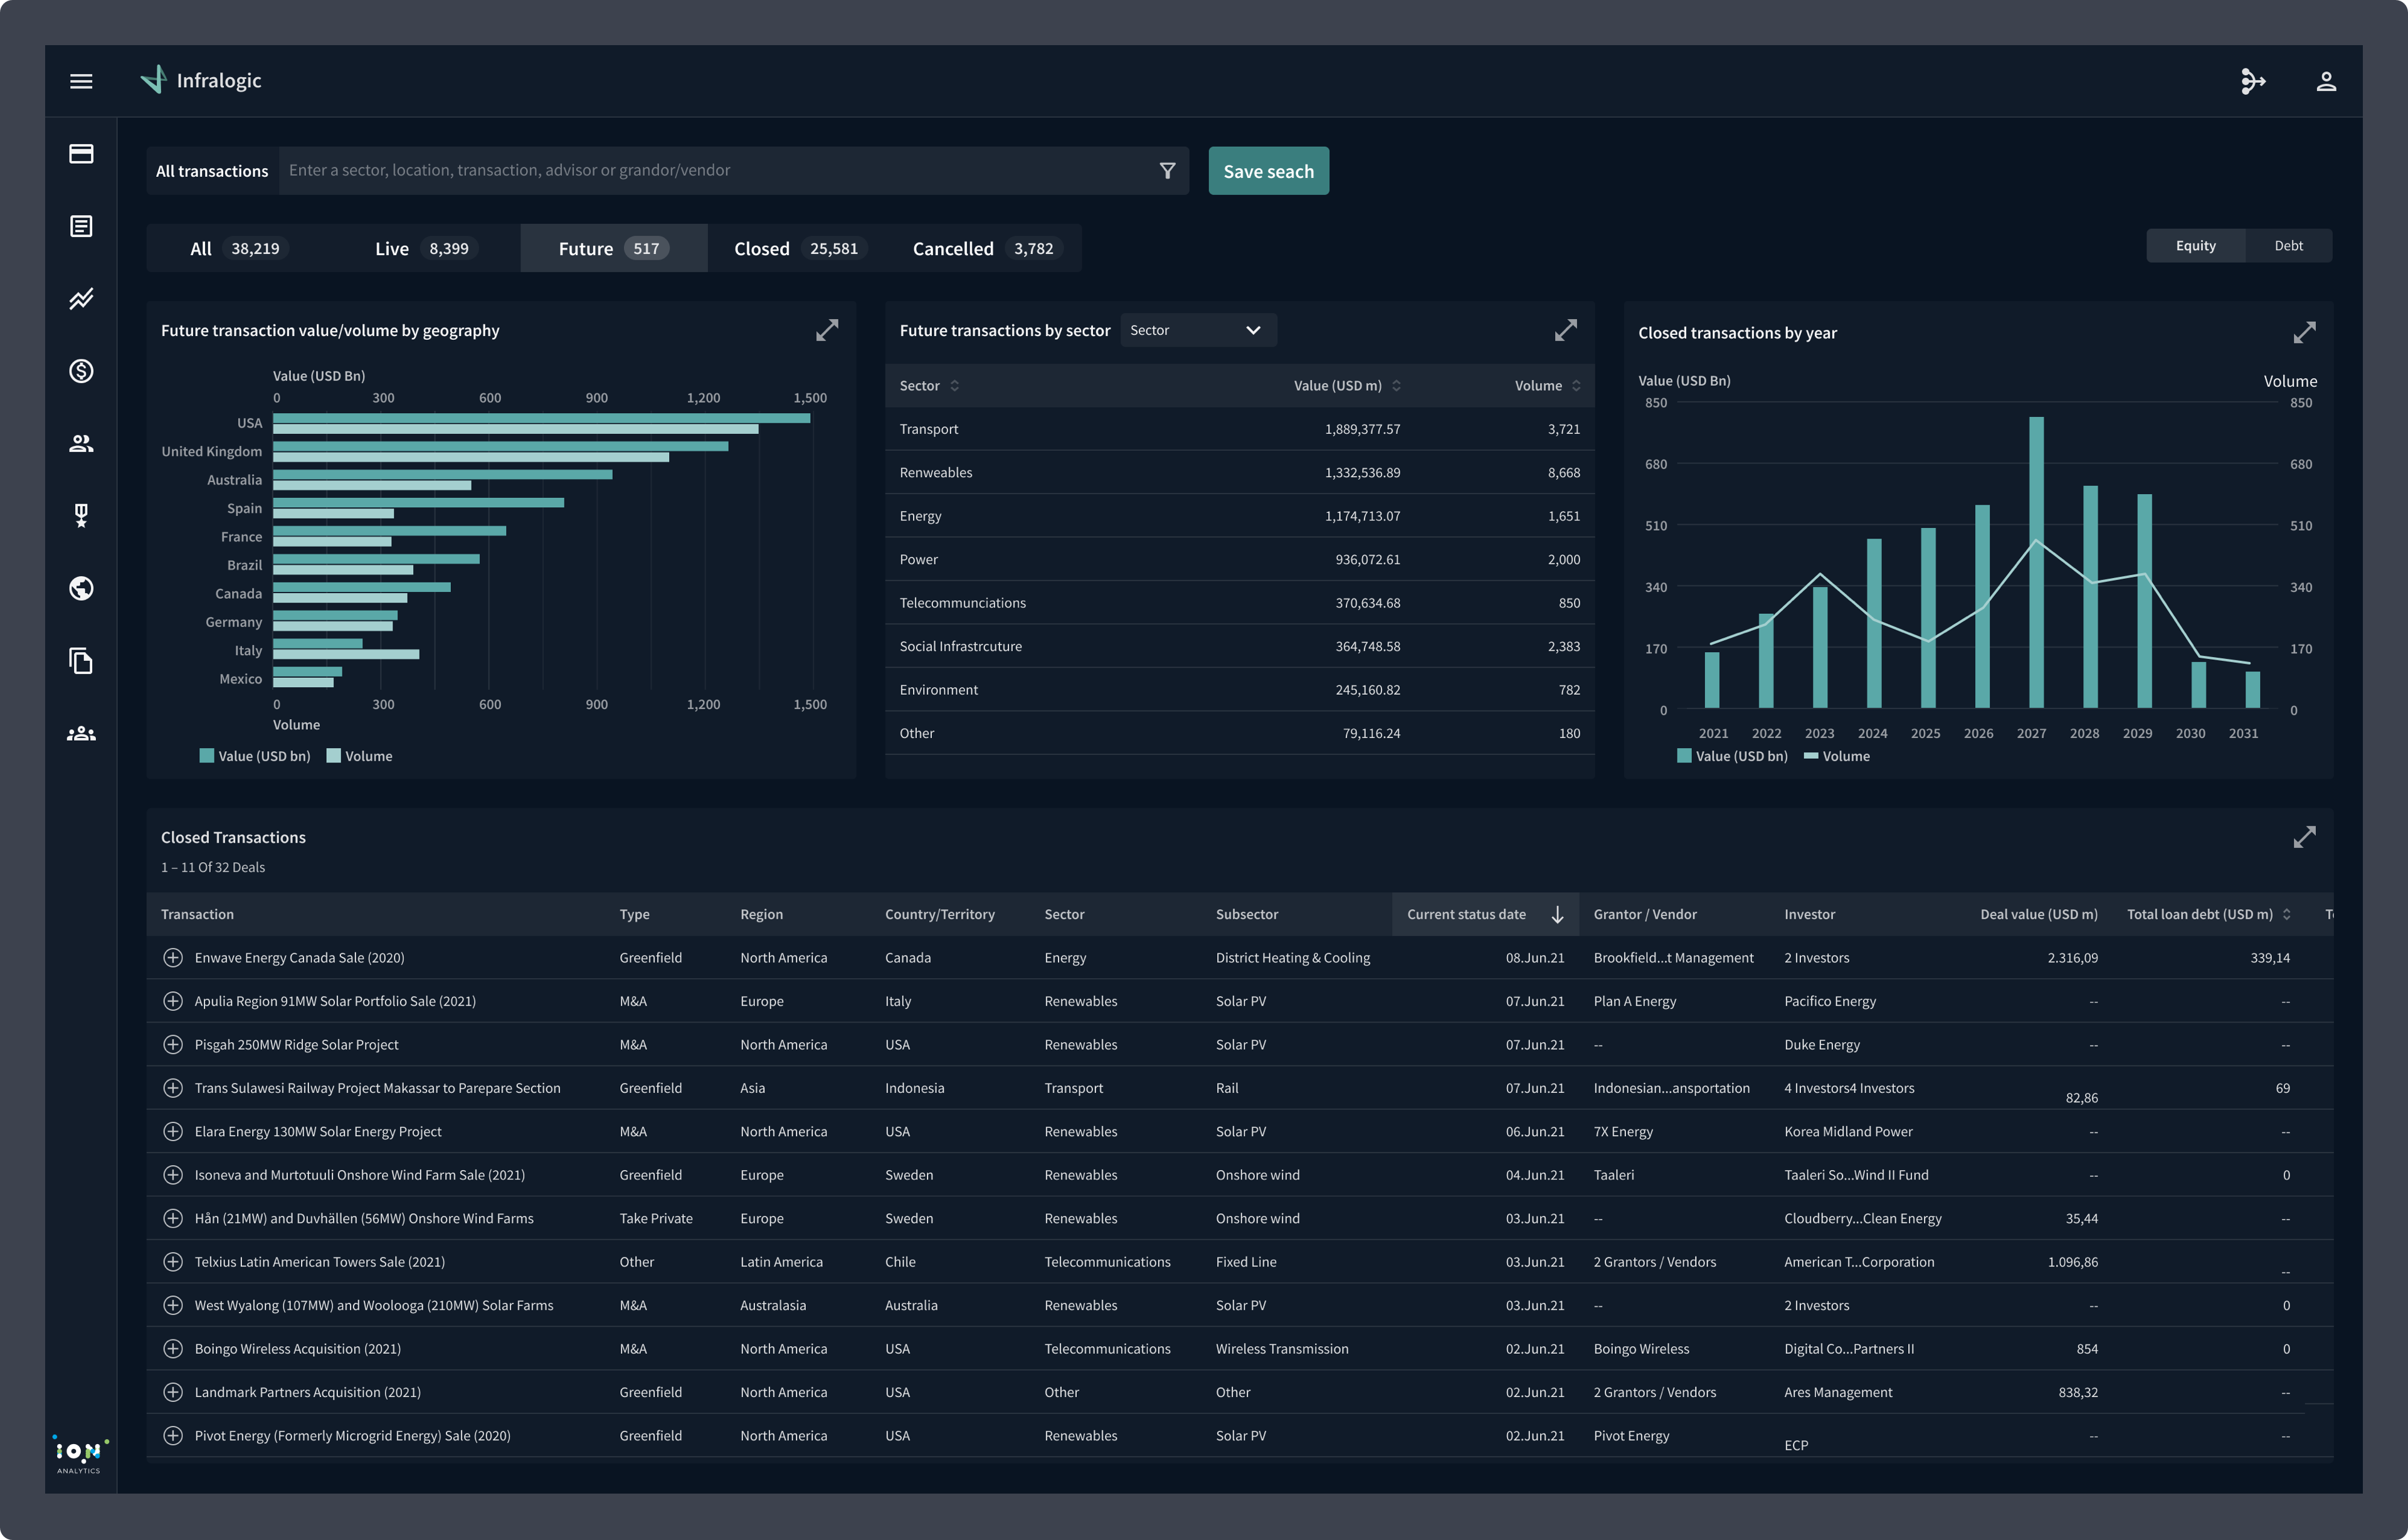
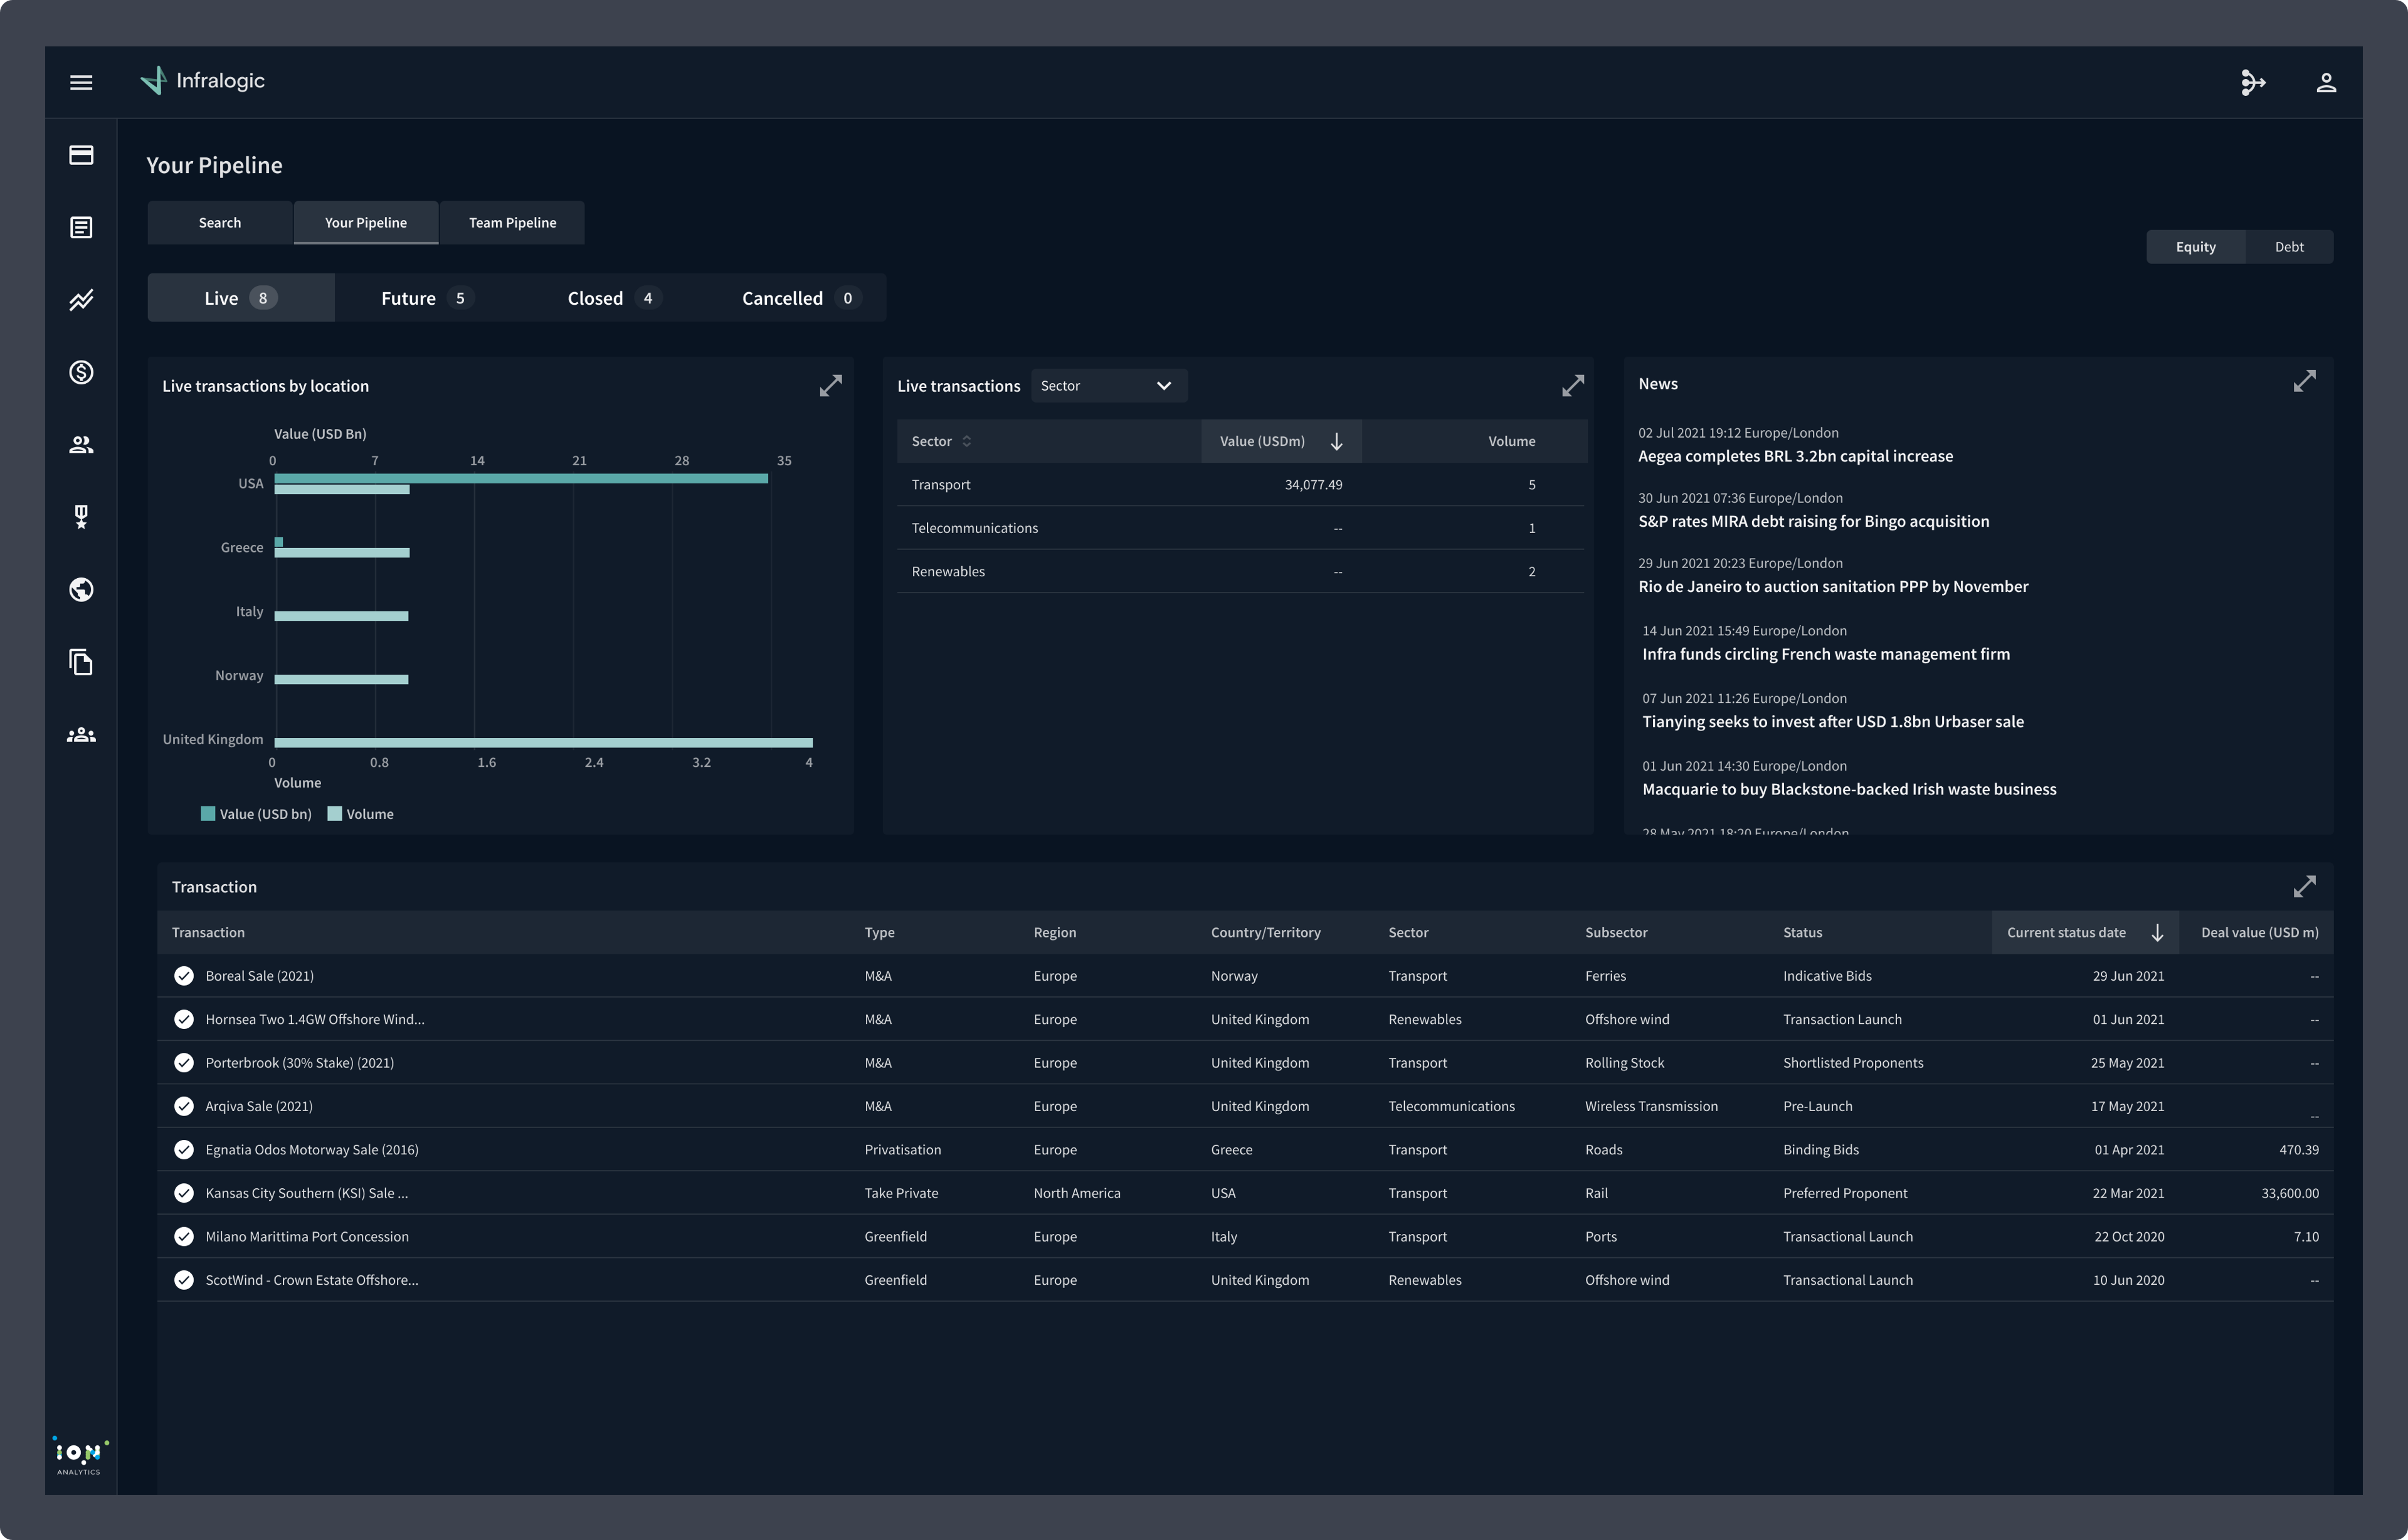
The dashboard offers investors comprehensive mapping of infrastructure transactions. Using a machine learning algorithm, it predicts future transactions by analysing assets held in mature funds for 5-7 years. Investors can screen the market based on their mandates, save searches, and receive notifications for matching transactions. Data visualisation tools provide quick market overviews, and opportunities of interest can be added to their pipeline or detailed via transaction tear-sheets.
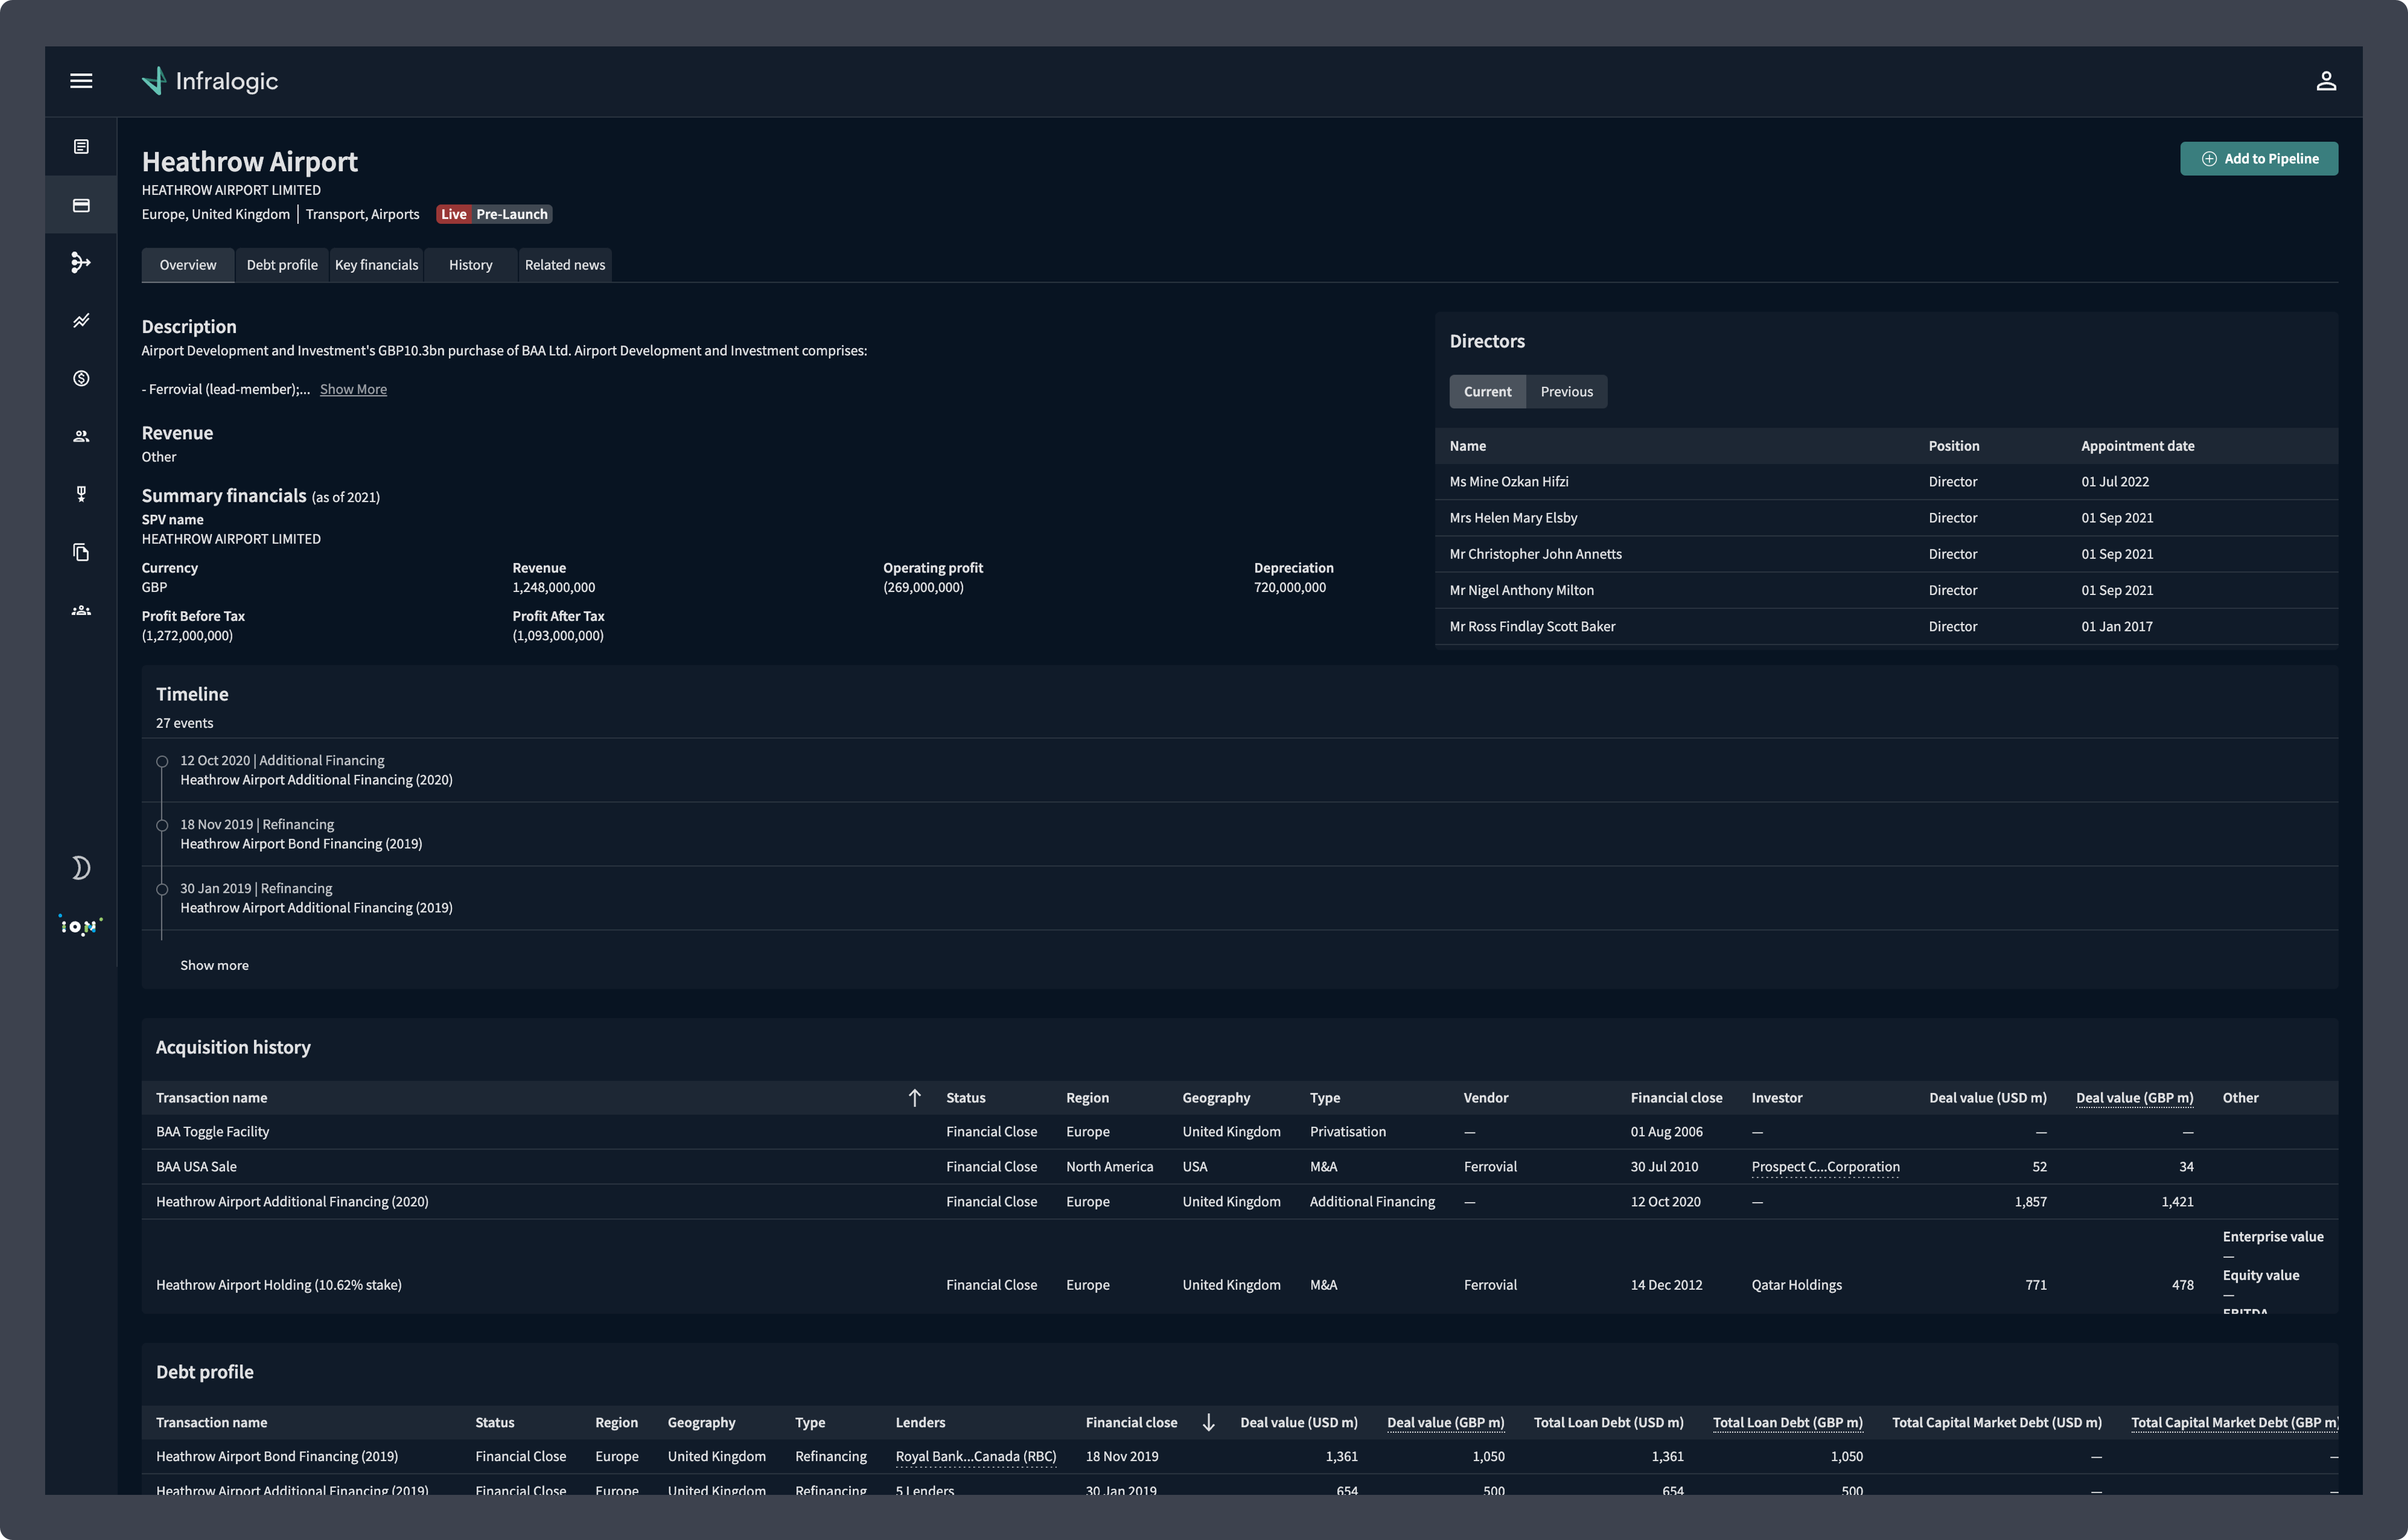
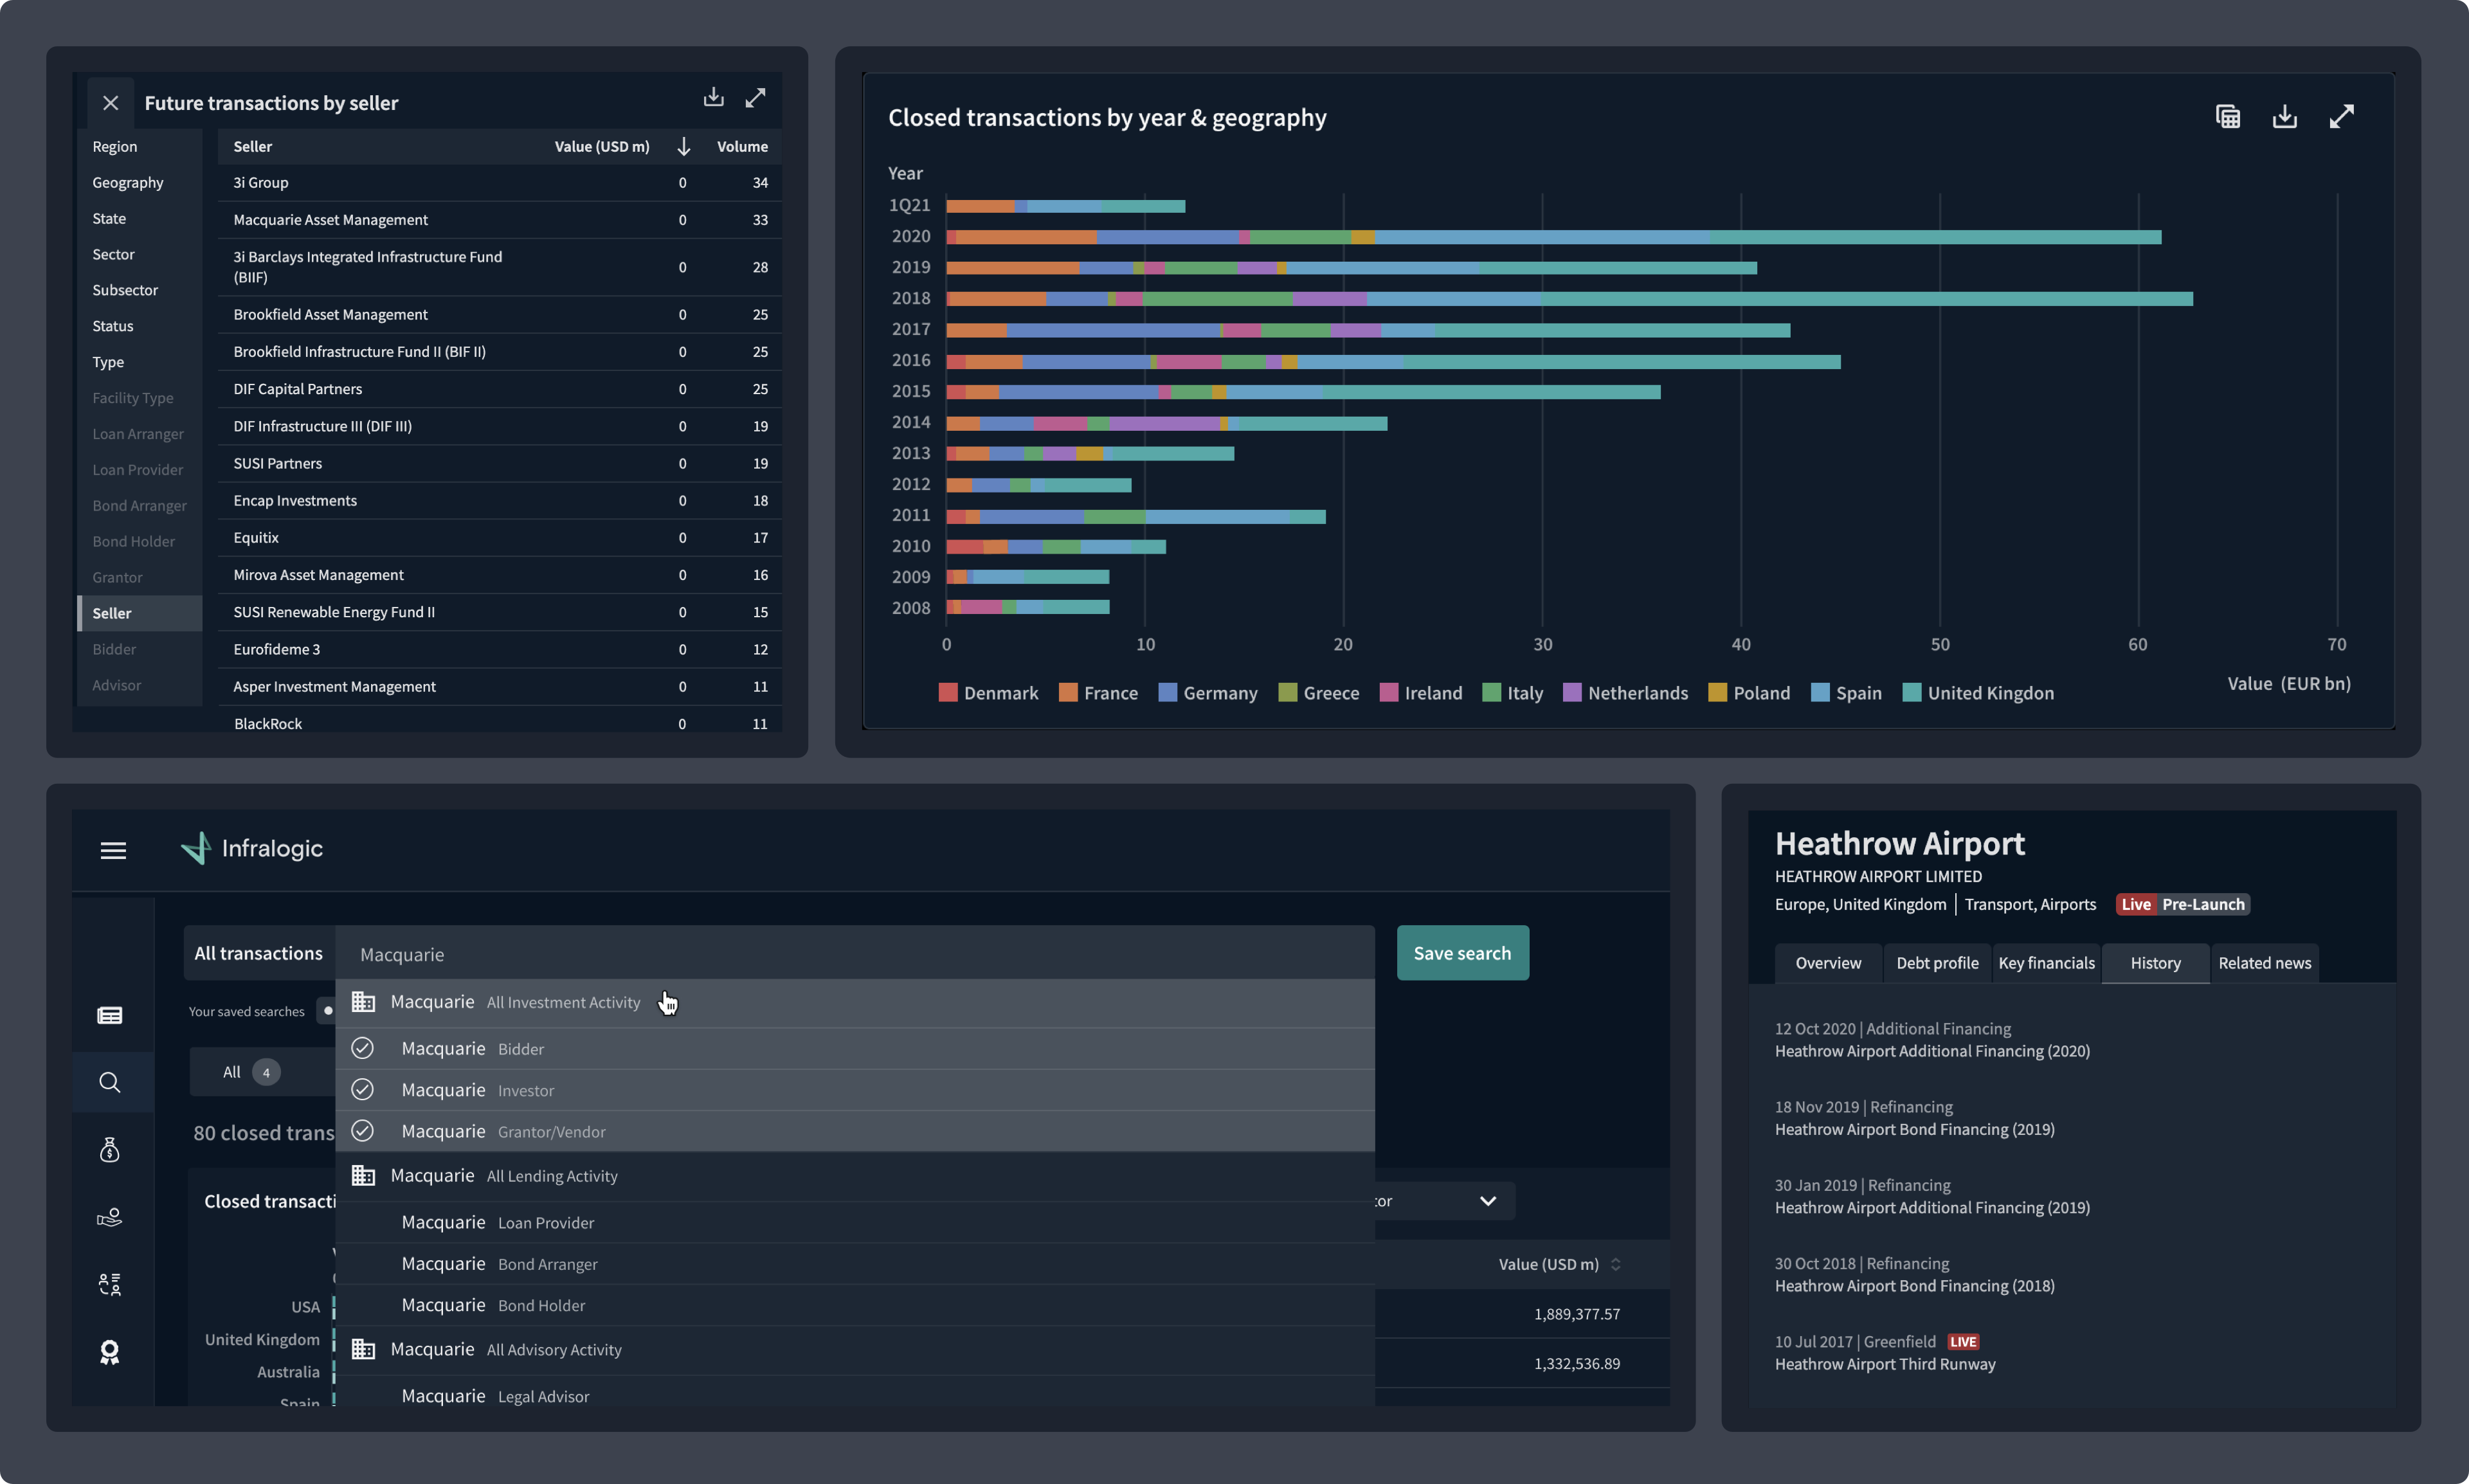
Once a transaction of interest has been identified by the investor, they are then able to get a deeper understanding of an asset's structure, with description, who is on the board, competitor snapshot, related news and Key financials to help perform deeper asset valuation analysis. An event-driven timeline clearly delineates the acquisition history of an asset, as well as highlighting live and future transactions, giving the most comprehensive overview of any infrastructure asset which wasn’t available on the market, until the release of Infralogic..
Investors can create a workflow-aligned pipeline to systematically track transactions of interest. New developments, such as a new bidder in a live process, trigger immediate actionable alerts, keeping users well-informed about market activities. Curated news and analysis offer additional context, including regulatory frameworks, for assets in the pipeline. This personalised pipeline seamlessly integrates into the company’s broader pipeline, enabling users to present well-informed investment ideas in committee meetings.
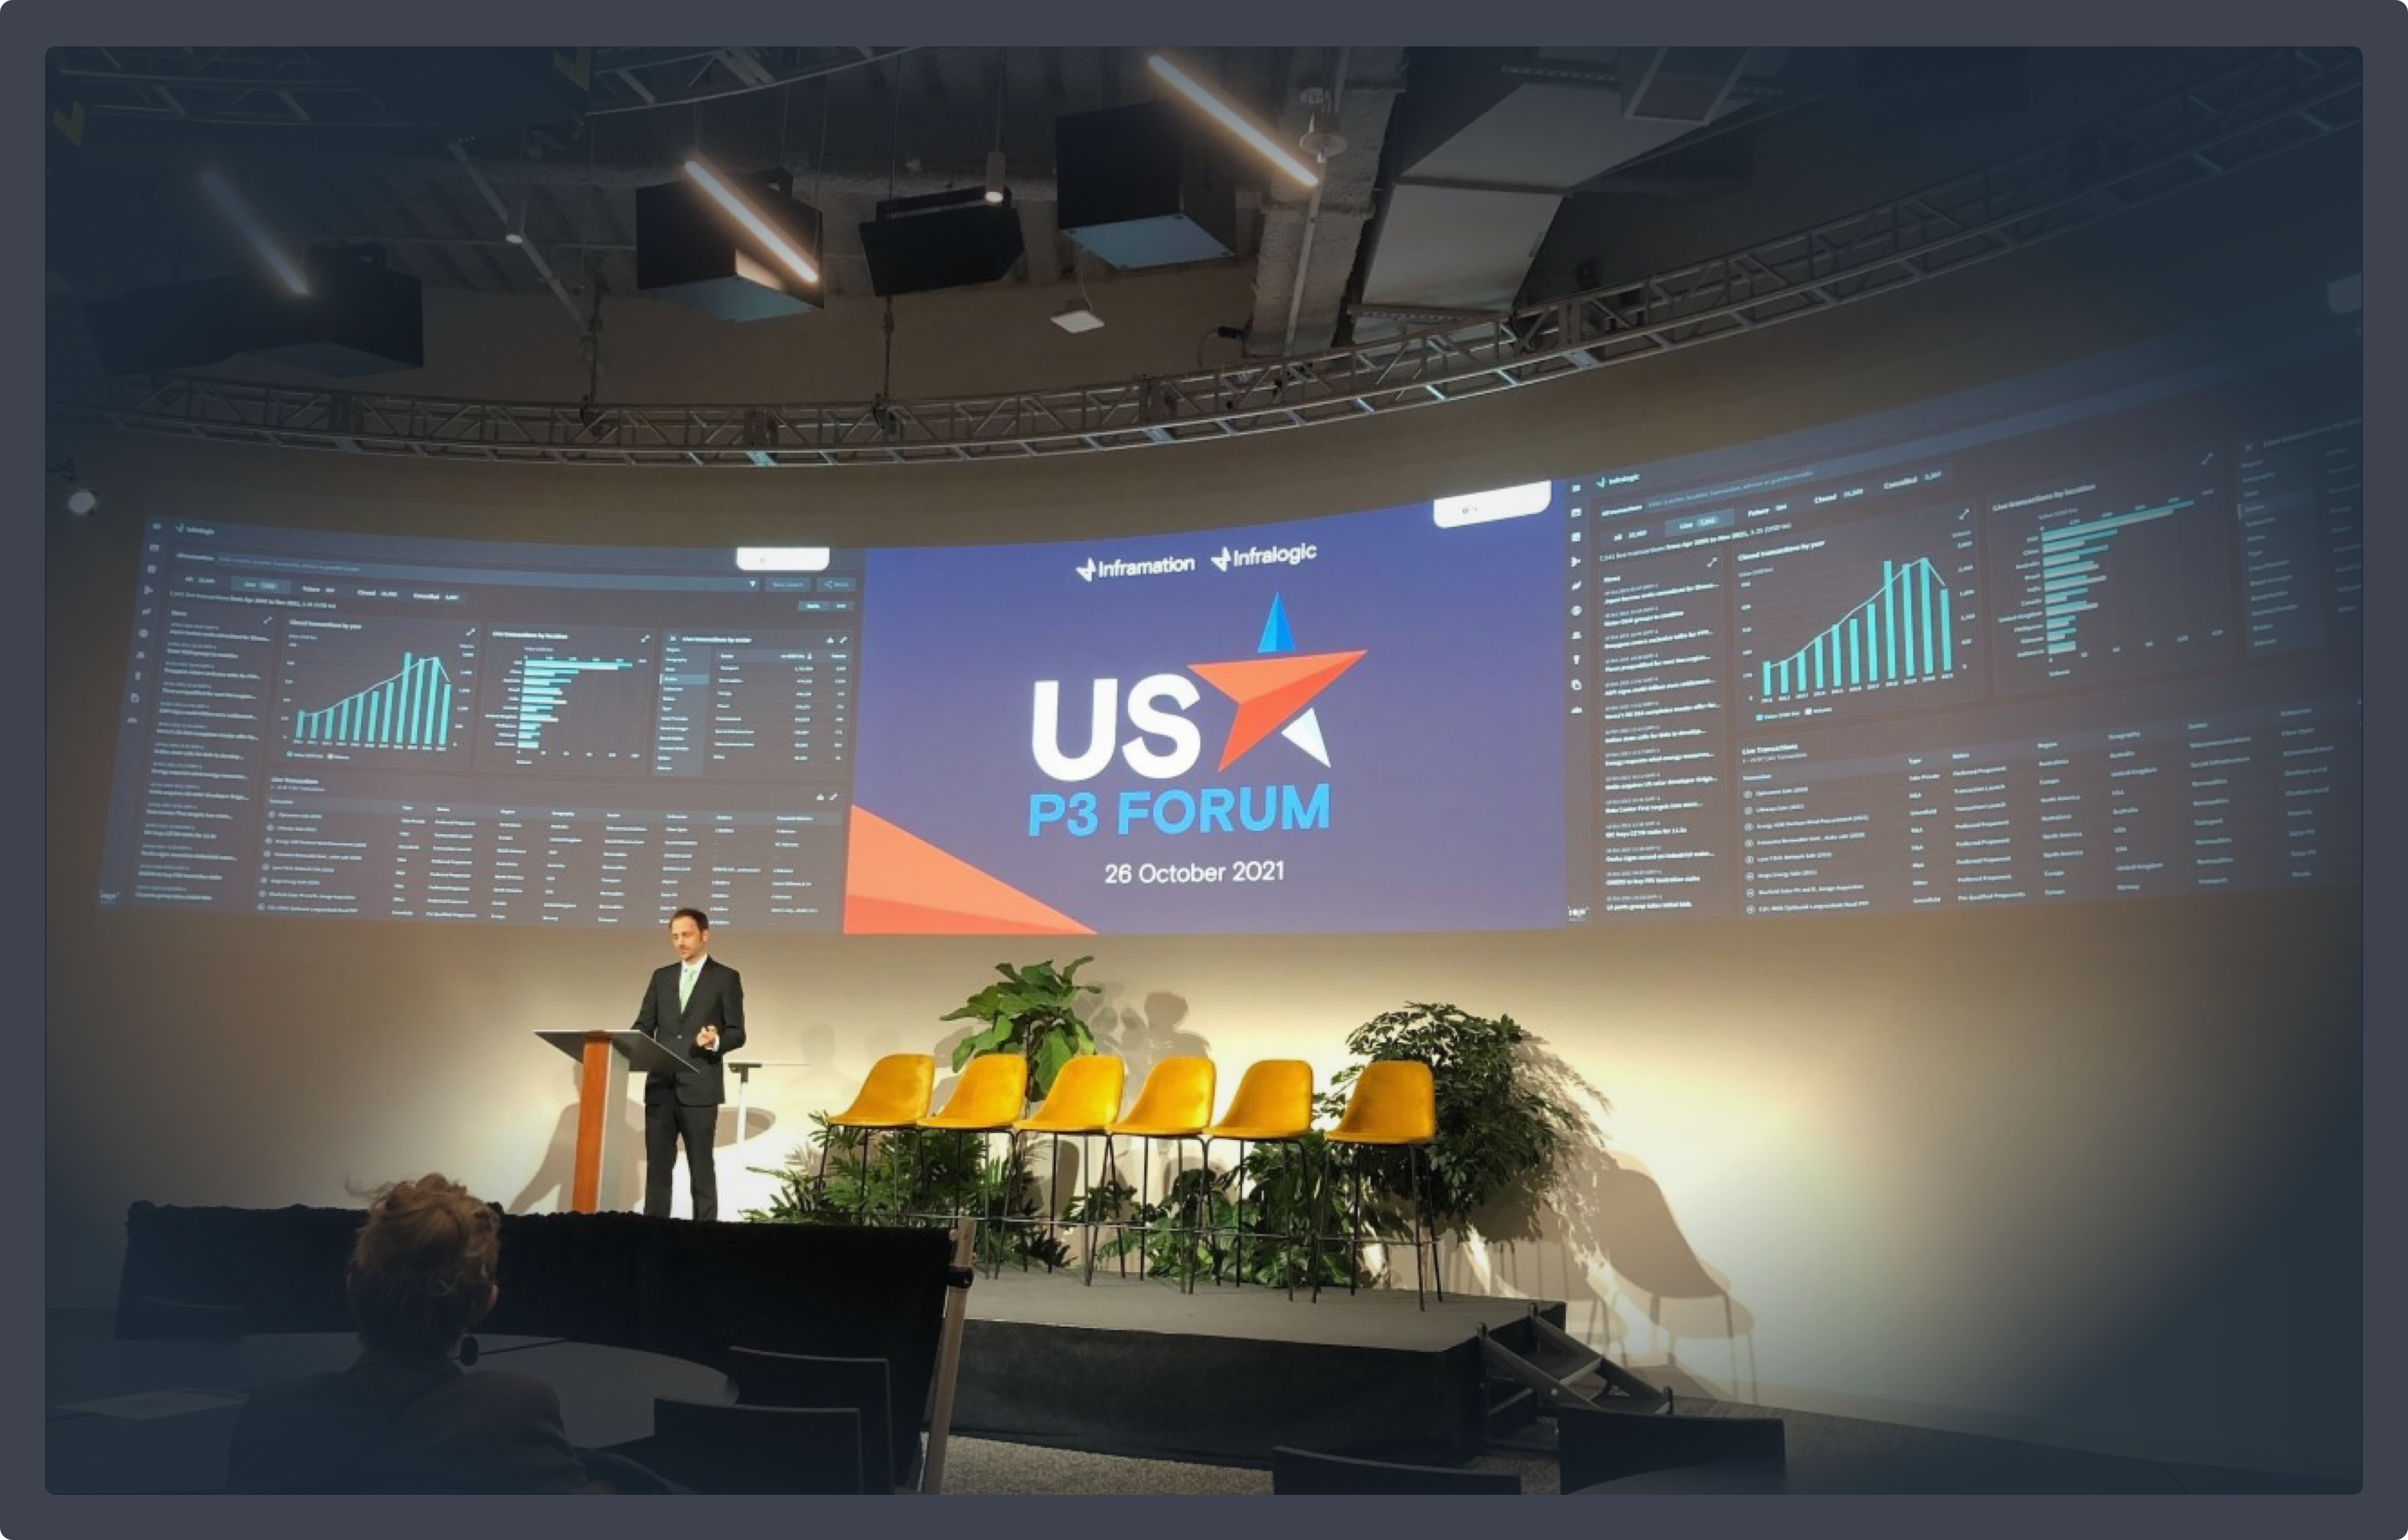
A beta programme was launched with over 20 clients over a three month period. At the end of the beta all clients had transitioned to the new Infralogic and no longer used the legacy platform. Some of the key learnings from the Beta programme were that the market was very opaque and finding future transaction opportunities was key to winning investment mandates. After the successful beta program the product was officially launched at the US P3 Forum in New York - one of the largest Infrastructure conferences in the market.
Client Retention - initial feedback indicated that the predictive analytics coupled with the deal origination capabilities in the platform provide a unique offering that helped differentiate Infralogic from the competition enabling sales teams to increase uplift with existing clients.
Increased Engagement - in the 12 months since the launch of Infralogic the platform saw record monthly usage of 52k page views surpassing the legacy product record usage of 38k page views.
Reduced Cost of Development - the infralogic product formed the foundation of the IONA design system. Not only did this allow consistent visual language and cohesive user experience, but a reduction in cost and time to validate hypotheses, enabling the business to bring new products to market at an accelerated pace.
72%
Click-Through Rate - on e-mail alerts from the pipeline engine.
1/3
Increase in MAU - compared to legacy product Year-On-Year.
25%
Reduction - in contractor and agency staff, due to gained efficiencies of using a design system.